
Fig. 1.
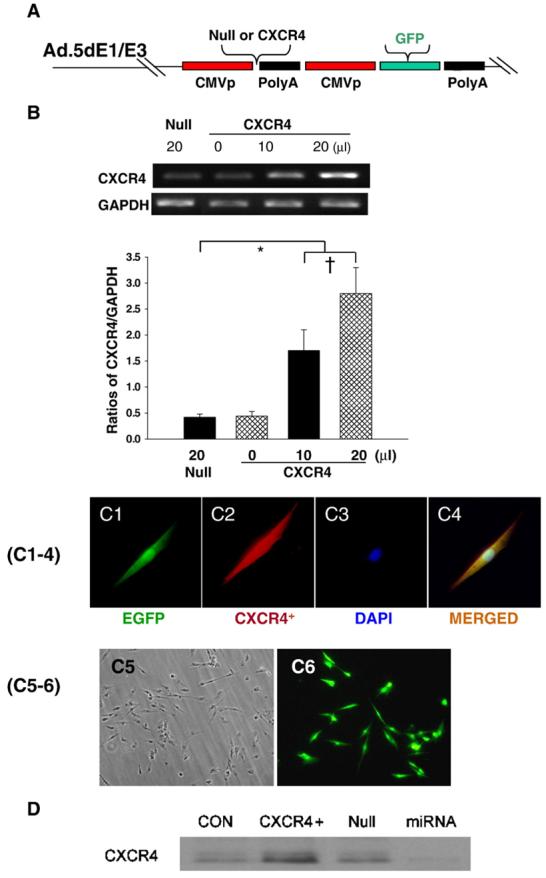
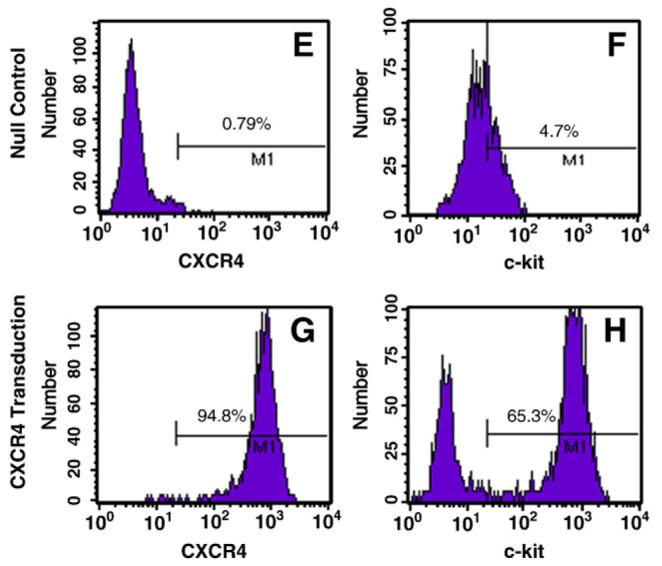
A: Generation of recombinant adenovirus vectors. B: RT-PCR for CXCR4 overexpression in MSCs. Panel B shows dose dependent CXCR4 overexpression. Null indicates Ad-null-GFP group. *p<0.05 vs. null group; †p<0.05 vs. CXCR4 (0 μl) group. Values mean±S.E.M., n=6 for each group. C(1–4): Immunofluorescence staining for EGFP and CXCR4. Panel C1 shows EGFP positive MSC, C2: Same MSC as “C1” except CXCR4 antibody staining (red color); C3: Same MSC as “C1” except nuclear staining by DAPI (blue color); C4, Same MSC as “C3” except DAPI co-localized with CXCR4 antibody staining and EGFP. Color codes for antibody staining are indicated. Panels C5–6 show the uniform transfection of MSCs with GFP and CXCR4 genes. C5, Non-transfected MSCs; C6, Adenovirus mediated EGFP and CXCR4 MSCs. Most of MSCs are uniformly transfected with EGFP and CXCR4 genes. D: CXCR4 expression on the membrane was determined by Western blotting using MSCs membrane extraction. CON indicates control group; CXCR4+, Ad-CXCR4/GFP group; Null, Ad-null-GFP group; miRNA, AdmiRNA targeting CXCR4 group. E–H: Flow cytometry of MSCs. Ad-null characterized cell fraction expressing CXCR4 (E) and c-kit (F); Ad-CXCR4 (G) and (H). Horizontal bar of each label in panel represents subpopulation of MSCs.