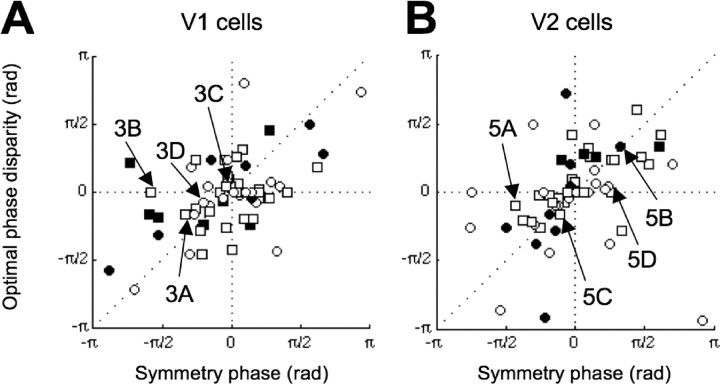
Figure 8.
Relationship between symmetry phase and optimal phase disparity. A, The optimal phase disparity (stimulus phase disparity producing the maximum spike rate) was correlated with the symmetry phase in the V1 population. The standard energy model predicts points that lie along the diagonal. The filled symbols represent cells with significant optimal phase disparity (bootstrap resampling, p < 0.05). The shape of the symbols indicates monkey identity. B, A similar correlation was found in the V2 population. Cells in both V1 and V2 seem to use RF phase disparity to build odd-symmetric tuning. Note that, in this plot (unlike Fig. 6), the symmetry phase is not reflected at ±π/2. Because both variables are circular, the full range can be used.

