
Figure 2.
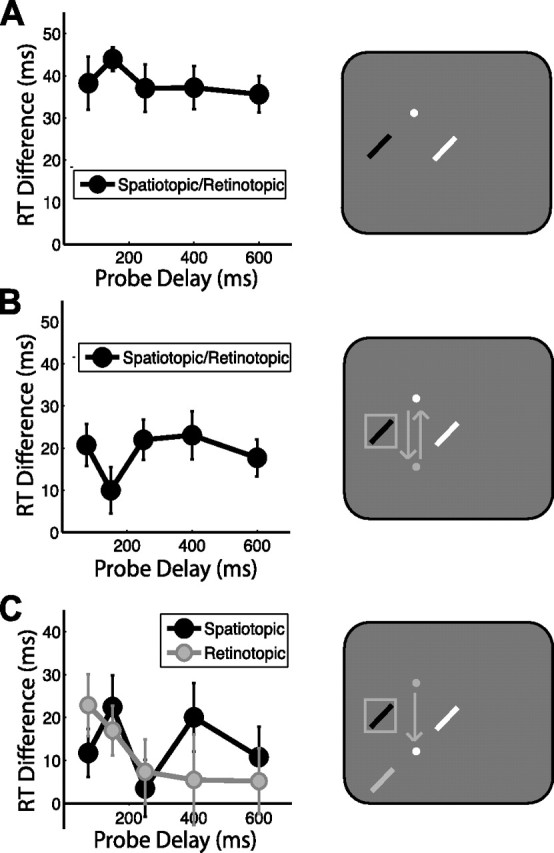
Attentional facilitation: task-relevant spatiotopic location, experiment 1. Attentional facilitation is plotted as the difference in RT for probes appearing in the spatiotopic and retinotopic locations compared with the control location baseline (zero). Positive values indicate attentional facilitation (RTs faster than at control locations). Data are plotted as a function of probe delay. The right column illustrates sample probe locations for each experimental condition colored according to the plot legends on the left, with white indicating the control location. White and gray dots indicate final and previous fixation locations, respectively; squares indicate cued locations, and arrows indicate saccade patterns. A, No-saccade task. B, Return- saccade task. C, Saccade task. Error bars indicate SEM after normalization to remove between-subject variability (Loftus and Masson, 1994); n = 16.