Figure 6.
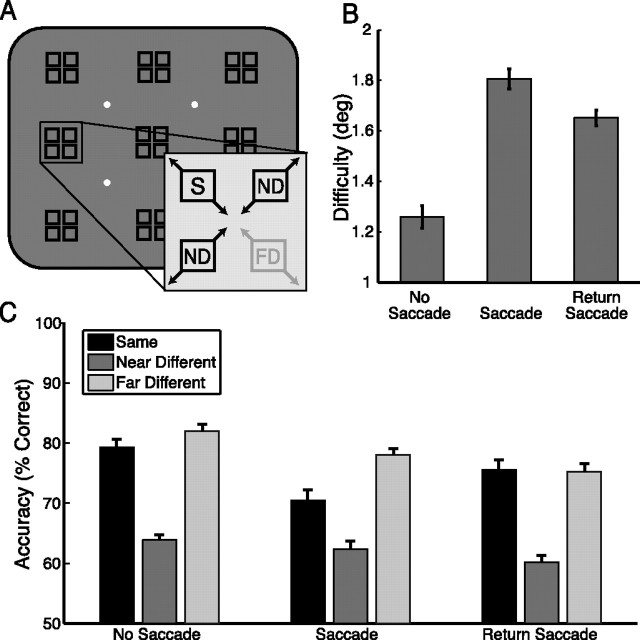
Memory test performance, experiment 1. A, Arrangement of possible fixation locations (white dots) and cue/probe locations (black squares). Each of the nine cue/probe regions contained four possible positions; the memory test stimulus always appeared in the same region as the cue. Separation distance between test positions was adjusted after every run to keep performance ∼75% correct. Separation distance was increased after blocks of poorer performance and decreased after blocks of better performance. Inset illustrates relationship of test positions within a region: S, same position as the cue; ND, near different position in the adjacent horizontal or vertical direction; and FD, far different position along the diagonal. B, Task difficulty is plotted for each of the three tasks, given as the separation distance in degrees of visual angle required to correctly perform the memory task 75% of the time. Larger values indicate increased difficulty. C, Accuracy on the memory task when equated for difficulty. Percentage correct is given when the test stimulus appeared in the same, near different, and far different locations for each of the three tasks. Near different positions should be more difficult to correctly reject because of their close proximity to the cued location. Error bars indicate SEM after normalization to remove between-subject variability (Loftus and Masson, 1994); n = 16.

