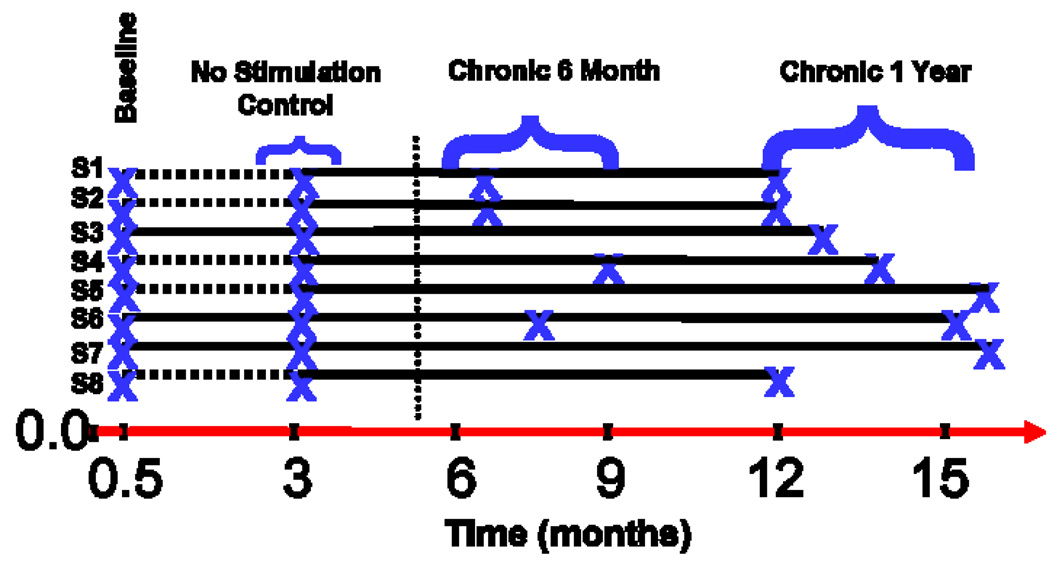
Figure 1.
Summary diagram with timeline indicating time of scanning and grouping of PET scan data. The subjects are labeled S1–S8; “x” denotes PET scan acquisition. The timeline starts at 0, when the VNS device was implanted. At 0.5 months, the VNS device was turned on in a random, blind manner. At 3 months into the trial, the blind was broken. The horizontal dashed lines (-----) indicate those subjects whose device was not turned on; they subsequently had the device turned on at three months. The solid horizontal line indicates a time period when the device was on. The vertical dotted line indicates time of a change in our institution’s PET camera. The subjects were grouped as follows: Baseline (all eight subjects scanned about 2 weeks after implantation and before any device was turned on); No Stimulation Control (5 subjects whose device was never turned on at 3 months into the trial); Chronic 6 months (4 subjects who were stimulated between 3 and 7 months); and Chronic 1 year (8 subjects who were stimulated between 9 and 14 months).

