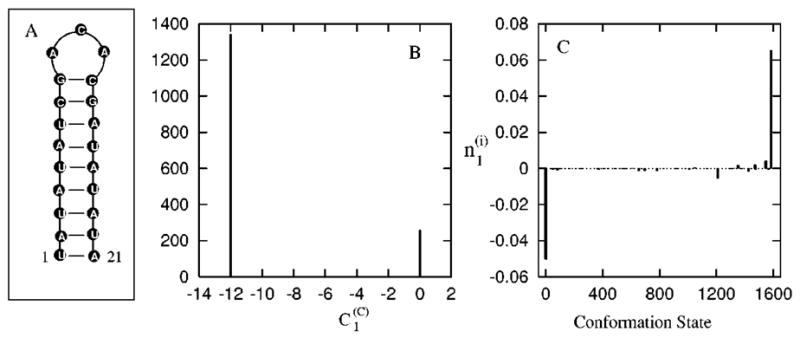
FIG. 8.

(A) The native structure and 21-nt RNA hairpin-forming sequence (see Ref. 40). (B) The histogram of for the slow mode ms = 1 at T=40 °C. The y axis represents the number of chain conformation c’s that have the value represented by the x axis. (C) The vector components of the eigenvector of the slowest mode ms=1 (see Ref. 40). The x-axis represents the conformations, and the y axis represents the corresponding components in the eigenvector.
