
Figure 2. Subcellular location of TLR9 changes upon BCR crosslinking.
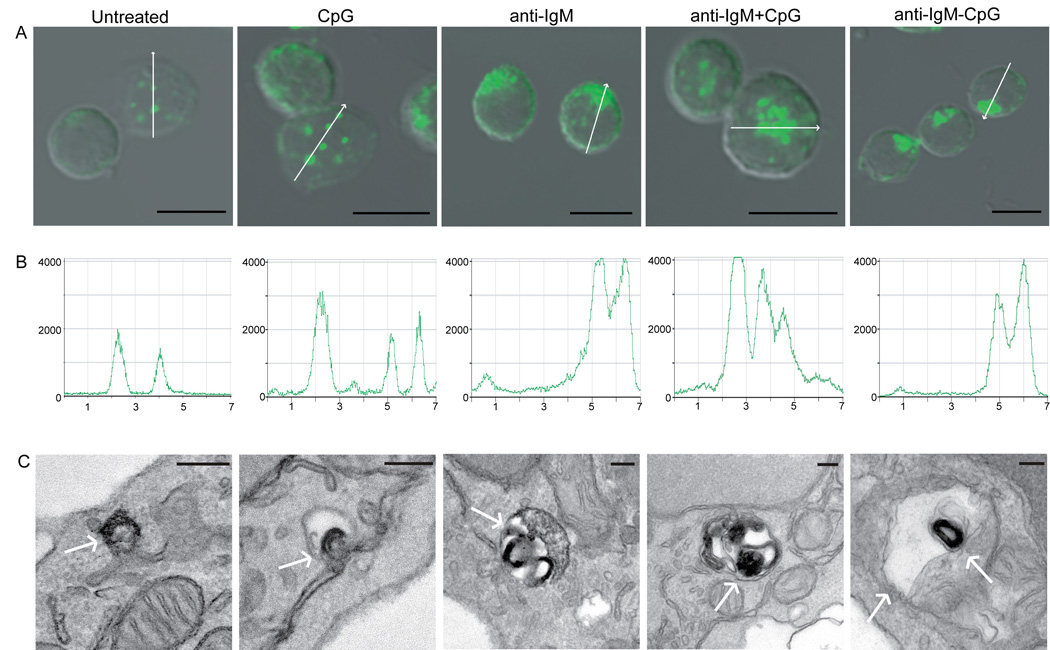
(A). Mouse splenic B cells were either untreated or stimulated with: 3µM CpG DNA alone; 10µg/ml anti-IgM alone; 10µg/ml anti-IgM plus 3µM CpG or 10µg/ml anti-IgM-CpG conjugate for 60 min. The merged confocal fluorescent Alexa 488 and differential interference contrast (DIC) images are shown. Over 500 cells were analyzed for each condition in 20 independent experiments and representative images are shown. Scale bars represent 5µm.
(B). The intensity analyses of Alexa 488- anti-TLR9 in representative cells in the direction shown by the white arrow in A.
(C). The immunoelectron microscopy images of cells stained with HRP-anti-TLR9 for cells treated as in panel A. The HRP reaction product DAB, visible as a dark stain, represents the location of TLR9 as shown by white arrow. Scale bars represent 100nm.