Figure 3.

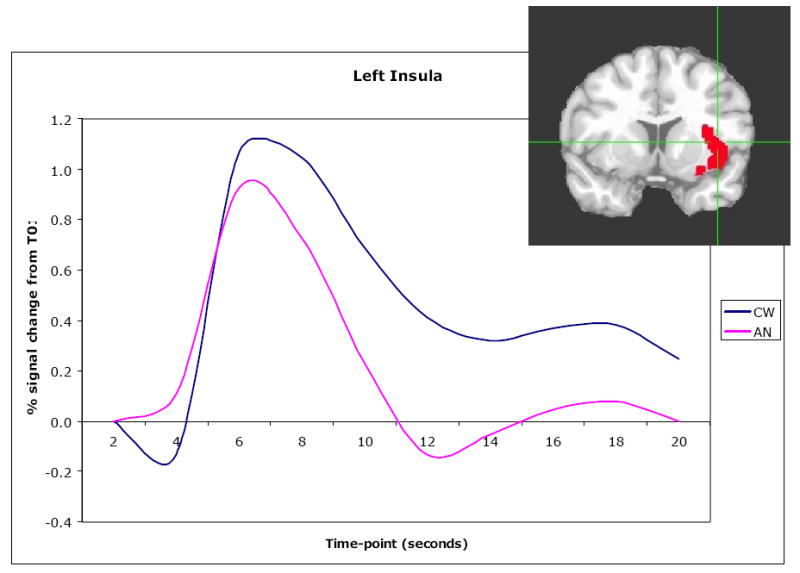
Coronal view of left insula ROI (x=-41, y=5, z=5). Time course of BOLD signal as a mean of all 16 recovered restricting-type anorexia nervosa and 16 control women for taste-related (sucrose and water) response in the left insula.

Coronal view of left insula ROI (x=-41, y=5, z=5). Time course of BOLD signal as a mean of all 16 recovered restricting-type anorexia nervosa and 16 control women for taste-related (sucrose and water) response in the left insula.