
Figure 5. Timing, quantification and potential effects of motion.
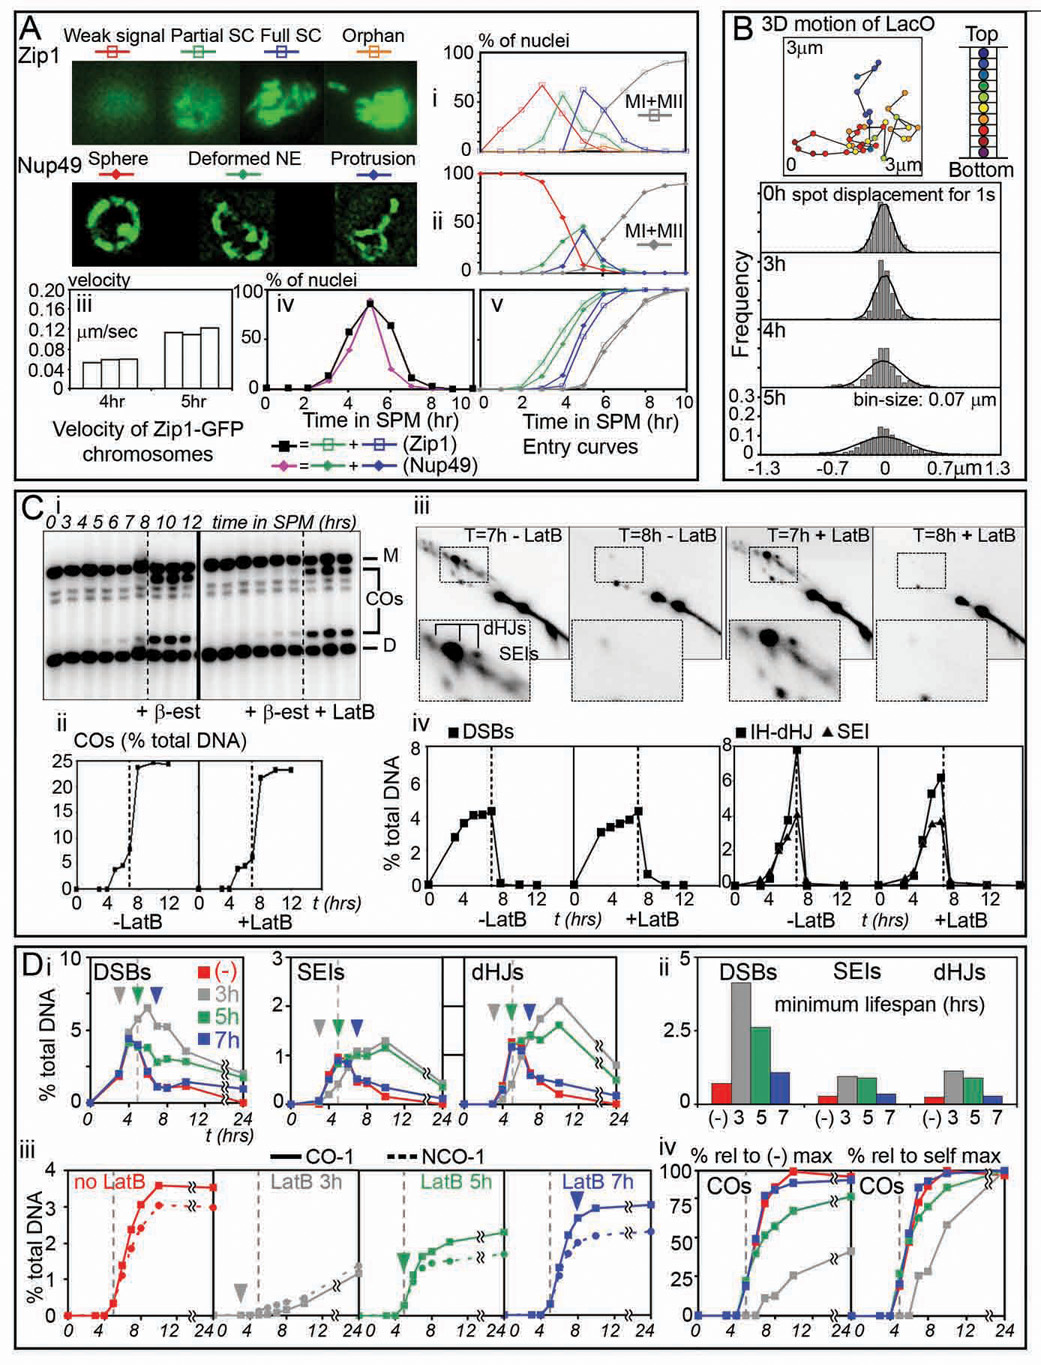
(A) Categories of expanding SC (i) and NE deformations (ii), quantified over time during meiosis in cells expressing either Zip1-GFP or Nup49-GFP (NKY3834 and NKY3992, respectively; n=100). Meiotic divisions (MI+MII) shown in grey. (iii) Mean velocities of random chromosomes (n=30) tracked at one sec intervals in 3 random nucleus during zygotene (4 hr) and pachytene (5 hr). (iv) Proportions of cells showing NE deformations (pink) and full or partial SC chromosomes (black) (same time courses as in i and ii, respectively). (v) Cumulative analysis showing when cells exhibiting NE deformations or onset of SC formation, detailed in (i) and (ii), have entered the corresponding stage. (B) Top: 3D trajectory of a telomeric lacO/lacI-GFP spot (NKY3835). Bottom: step-size distribution histograms of the 2D displacement of projected lacO/lacI-GFP signal, tracked every second for 2 min in 3 random nucleus at 0, 3, 4 and 5 hours in SPM. Predicted Normal distributions are indicated. (C) Meiotic recombination in ndt80-arrested cells, released from arrest at t=7 hr in the presence or absence of LatB (NKY3889). Recombination analyzed at HIS4LEU2 as described (Hunter and Kleckner 2001; Experimental Procedures). (i) Parental homologs, “Dad” (D) and “Mom” (M), DSBs and COs are distinguished on Southern blots via restriction site polymorphism. (ii, iv) DNA species as percent of total hybridizing signal with time after transfer to SPM. (iii) Representative 2D gels of SEIs and dHJs from the timecourses shown in (i). (D) Effect of LatB on recombination progression (NKY3990). Arrowheads indicate the time of LatB addition to aliquots of a same premeiotic culture [color code corresponds to (no addition), addition at t=3, 5, and 7 hours]. Dotted line at 5h helps graph to graph comparison. (i) Quantification of DSBs, SEIs, and dHJs species over time and (ii) corresponding lifespans (i.e. time when 50% of the initiated recombination events have entered or exited the corresponding stage). (iii) CO and NCO formation as percent of total hybridizing signal in LatB time-course experiments. (iv) Left panel: COs level relatively to the maximum level observed in the control culture (−). Right panel: for each culture, relative COs levels when compared to the maximum level observed in the corresponding culture.