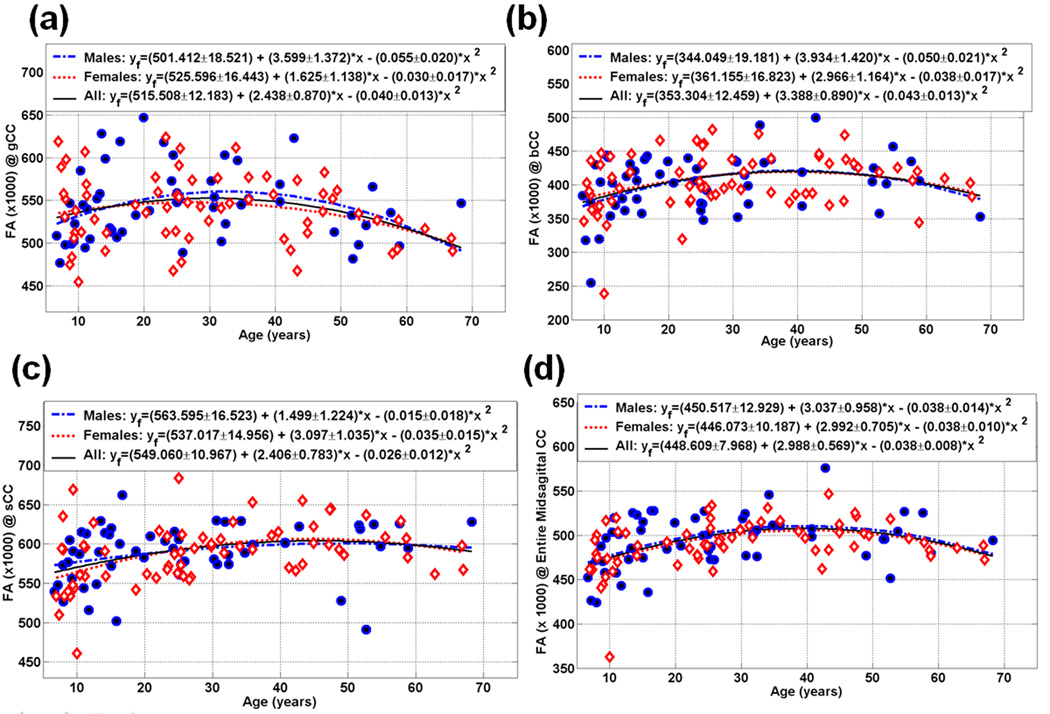
Figure 3.
Scatter plot of the measured and fitted data of the midsagittal callosal subdivisions fractional anisotropy (1000 × FA) as function of age for the (a) gCC (b) bCC , (c) sCC and (d) the entire CC (Note the inverted-U quadratic dependence of FA vs. age; see also Table 3).

