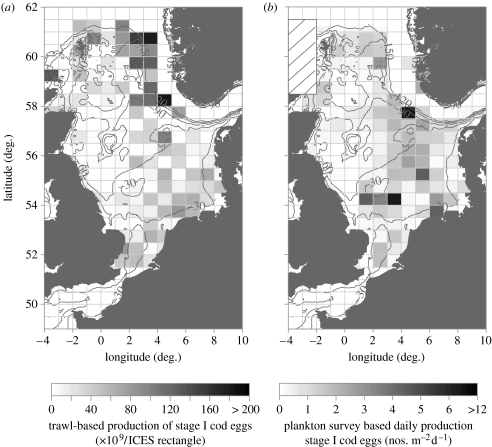
Figure 4.
(a) The distribution of cod egg production per ICES rectangle in 2004 based on Q1 trawl survey data. (b) The distribution of stage I cod egg production averaged to ICES rectangle resolution from the 2004 ichthyoplankton survey. Cross-hatched area indicates where no plankton samples were collected.

