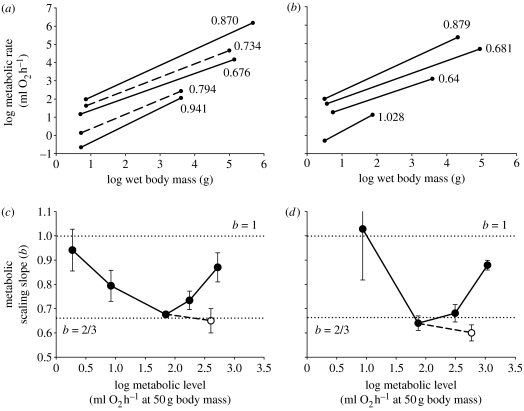
Figure 1.
Scaling of metabolic (respiration) rate in relation to wet body mass in (a,c) mammals and (b,d) birds exhibiting various physiological states (data from sources in table 1). (a,b) The dots at the ends of each log–log least-squares regression line denote the minimum and maximum body masses for each sample. The scaling slopes of solid lines are significantly different from 3/4, whereas the slopes of dashed lines are not significantly different from 3/4. The physiological states for the scaling lines are in ascending order for mammals: hibernating at 5°C, torpid at 20°C, resting, field active and maximally active; and for birds: torpid at 15–16°C, resting, field active and maximally active. (c,d) Scaling slopes (b±95% confidence limits) versus metabolic level at 50 g body mass. Filled circles denote various levels of activity from minimal to maximal, whereas open circles indicate cold-exposed metabolic rates. For the different levels of activity, note the approximately U-shaped relationship shown for both mammals and birds with extreme values of the scaling slopes near 2/3 and 1 (indicated by dotted lines), as predicted by the MLB hypothesis.

