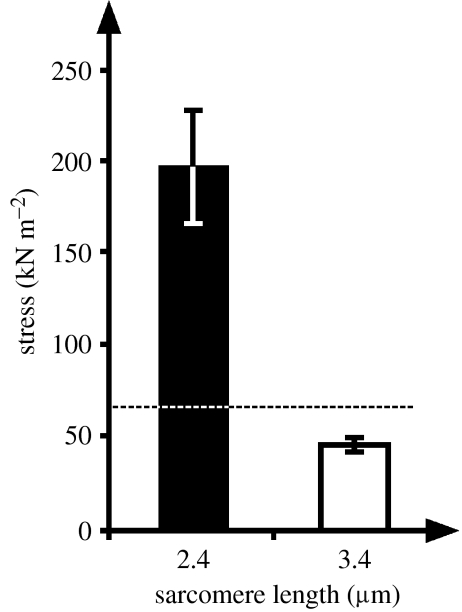
Figure 2.
Stresses (total force/cross-sectional area) of single myofibrils (n=6) at average sarcomere lengths of 2.4 and 3.4 μm. The dashed line represents the predicted force for a sarcomere length of 3.4 μm based on the force-length relationship and the actual forces observed at 2.4 μm. Note that the stress was much greater at 2.4 than 3.4 μm, thereby indicating that all stretch experiments were performed on the descending part of the force–sarcomere length relationship. Single myofibrils were obtained from rabbit psoas and all experiments were performed at a temperature of 21°C.

