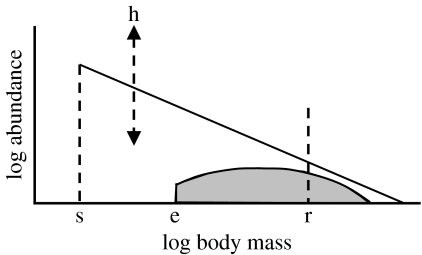
Figure 1.
Schematic of the process used to predict total animal biomass and teleost or elasmobranch biomass in each grid cell. The height (h) of the size spectrum and the smallest size class (s) in the spectrum are functions of PP (which affect phytoplankton biomass and size composition). Teleosts or elasmobranchs (shaded area) are assumed to be part of total community of animals larger than the size of their eggs or live young (e) and their biomass in all size classes is predicted in relation to an assumed biomass in a given size class (r).

