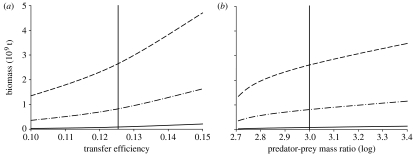
Figure 5.
Sensitivity of global biomass estimates to the assumed (a) transfer efficiency and (b) predator–prey mass ratio. Dashed lines represent all biomass, dash-dotted lines represent teleost biomass and solid lines represent elasmobranch biomass. The vertical lines pass through the values of ϵ and log μ used in the main analysis. Additional sensitivity analyses are provided in the electronic supplementary material.

