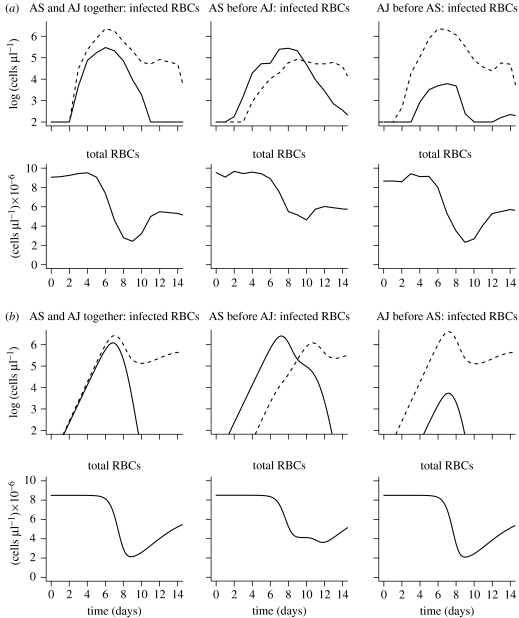
Figure 3.
(a) Experimental data and (b) simulations for mixed infections. The dynamics of infection with both AS (solid line) and AJ (dashed line) parasites following either simultaneous infection or infection with one parasite strain 3 days prior to the other. Plots show the parasite density of the individual strains and the total number of RBCs as a function of time since infection. The simulations describe the experimental data on the dynamics of the first wave of parasitaemia, and the loss of RBCs. After about 12 days, when acquired immunity is expected to play an important role, the simulations begin to depart from the experimental data.

