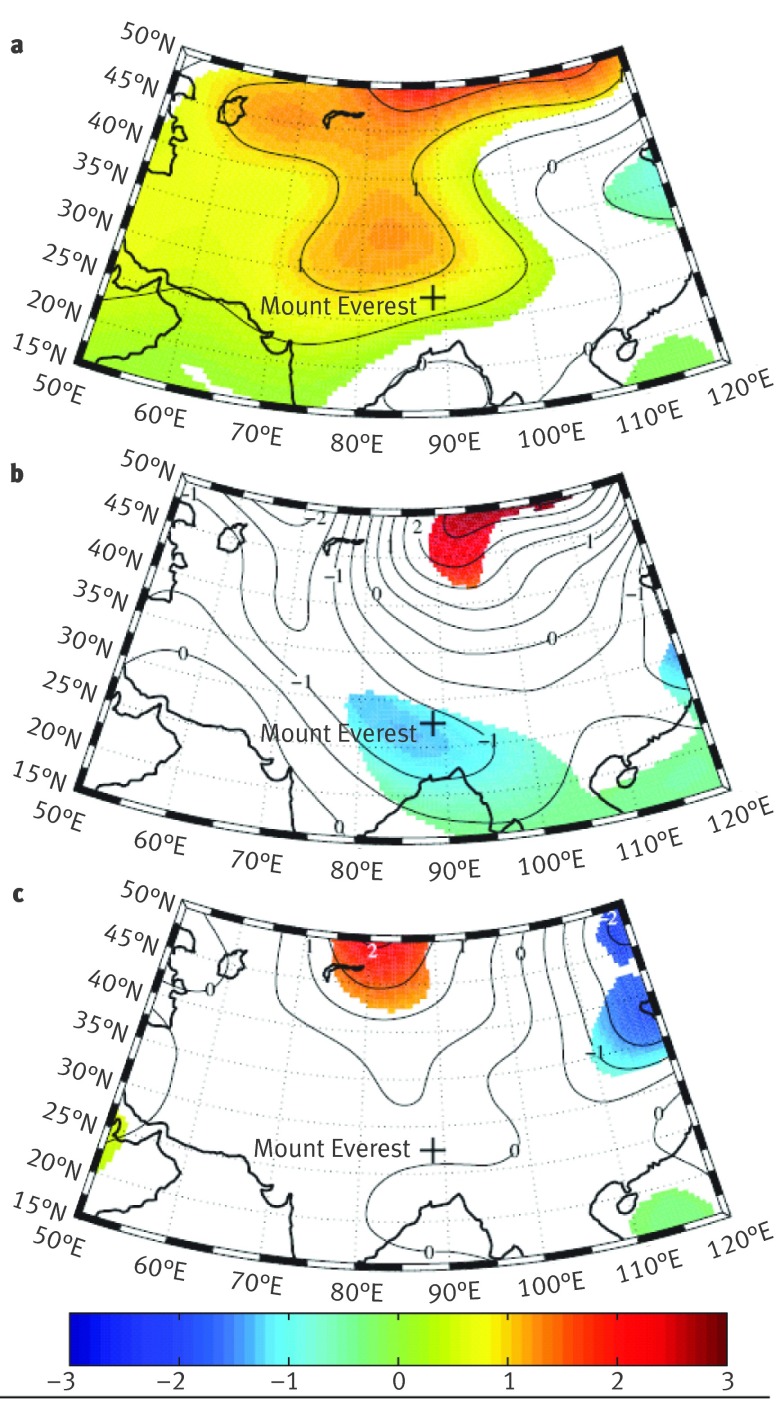
Fig 2 Composite of barometric pressure (millibars), expressed as anomaly to long term mean pressure, at 9000 m above sea level over Asia during May 1975-2006. Shaded regions are those where barometric variations differ from mean pressure (P<0.05), which is complied from a resampling technique with 1000 randomised samples at the same location. (a) Large region of higher than mean pressure (P<0.05) near Everest coincides with 141 days on which mountaineers reached the summit. (b) On days with weather related deaths above 7000 m (score ≤8), Everest is in region of lower than mean barometric pressure (P<0.05). (c) No statistically significant pressure anomaly present on those days when non-weather related deaths occurred above 7000 m (score >8). For days when mountaineers reached the summit, average pressure anomaly in vicinity of Everest varied from -3 mb to 5 mb, whereas for days in which a weather related death occurred, average pressure anomaly varied from −6 mb to 2 mb. For days in which a non-weather related death occurred, average pressure anomaly varied from −4 mb to 5 mb

An official website of the United States government
Here's how you know
Official websites use .gov
A
.gov website belongs to an official
government organization in the United States.
Secure .gov websites use HTTPS
A lock (
) or https:// means you've safely
connected to the .gov website. Share sensitive
information only on official, secure websites.
