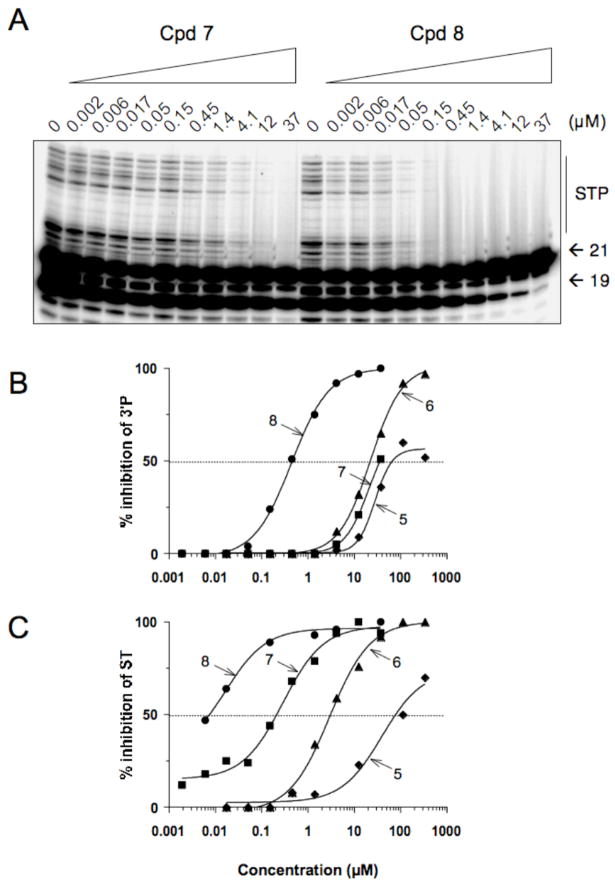
Figure 3.
Comparison of HIV-1 integrase inhibition by compound 7 and 8 in the presence of Mg2+. (A) Phosphorimager image showing a representatitve experiment. 21, 19 and STP correspond to the DNA substrate, the 3′-processing product and the strand transfer products, respectively. (B) HIV-1 integrase inhibition curve (derived from densitometric analysis of typical experiments) for 3′-processing. (C) HIV-1 integrase inhibition curve for strand transfer.

