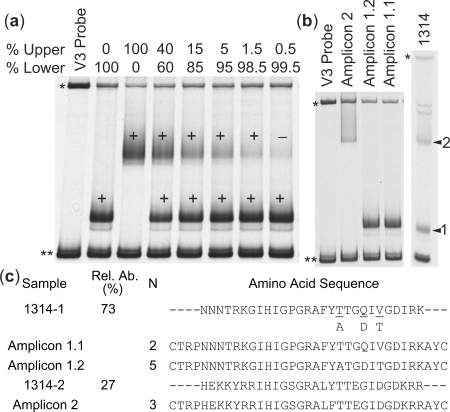
Figure 3.
Examination of the sensitivity of the biotin-V3 HTA. (a) Mixtures of two V3 PCR products were separated by the biotin-V3 HTA. The bands were cut from the gel, purified and sequenced. The plus sign indicates bands for which sequence was obtained, and the minus signindicates a band for which the sequence was not obtained. The asterisk indicates the single-stranded probe band, and double asterisks indicate the double-stranded probe band. (b and c) SGA of the env gene was conducted on Subject 1314. The migration of three different SGA-V3 PCR products and the original 1314 V3 PCR product are shown in (b). The V3 amino acid sequence of the extracted bands and the SGA amplicons, the relative abundance (Rel. Ab.) and number of SGA amplicons (N) are listed in (c).

