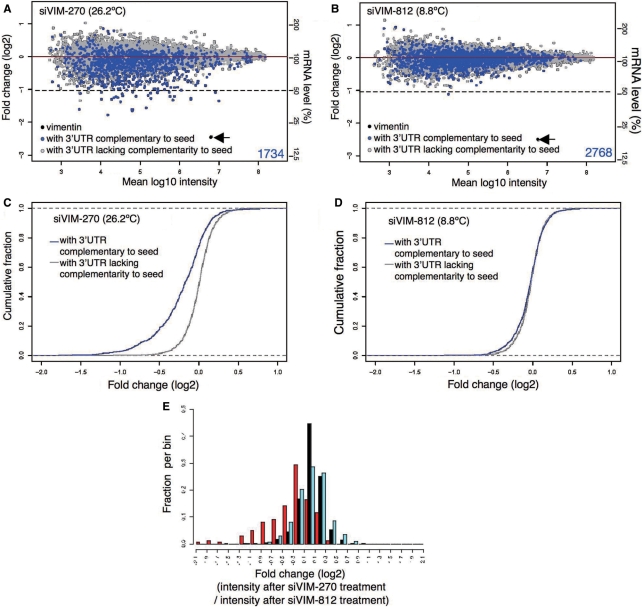
Figure 4.
Microarray-based off-target-effect profiling and data analysis. Profiles of transcript downregulation by (A) siVIM-270 and (B) siVIM-812. The cumulative distribution of transcripts from cells treated with (C) siVIM-270 and (D) siVIM-812, are shown as log2 of fold change to mock transfection. The blue line (C, D) indicates the cumulative fraction of transcripts with one or more sequence complementary to the siRNA seed in the 3′ UTR. The gray line (C, D) shows transcripts with no seed complementarity. Distributions of log fold change, defined as the log2 of expression in siVIM-270- or siVIM-812-transfected cells over that in mock-transfected cells, for mRNAs lacking seed complementarity are 0.221 ± 0.001 (C) and 0.016 ± 0.005 (D), respectively. (E) Comparison of microarray profiles of transcripts downregulated by siVIM-270 and siVIM-812. Only transcripts with 3′ UTR complementarity to two or more than two siRNA seed sequences were examined. Ordinate represents fraction. Abscissa represents signal intensity obtained after siVIM-270 treatment divided by that after siVIM-812 treatment. The blue and red bars denote the distribution of transcripts with 3′ UTR complementary to the VIM-812 and VIM-270 seed sequence, respectively. The black bar represents transcripts with seed complementarity to neither siVIM-270 nor siVIM-812.

