Figure 4.
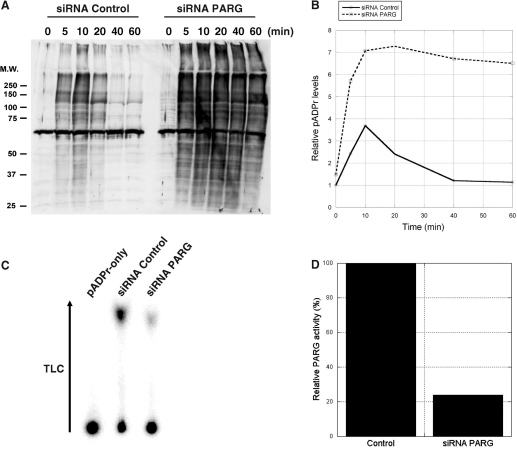
pADPr levels are increased and sustained in SK-N-SH cells treated with PARG siRNA following alkylation-induced DNA damage. (A) Time course western blot analysis of pADPr accumulation in SK-N-SH cells following 100 μM MNNG treatment in both control and PARG siRNA treated cells. Crude protein extracts were loaded and subjected to SDS–PAGE and immunoblotting. Blots were revealed with anti-pADPr polyclonal antibody 96-10 as described in Materials and methods section. (B) Western blot quantification of pADPr levels from control (full line) and PARG siRNA-treated cells (dashed line) following 100 μM MNNG treatment. (C) Evaluation of PARG knockdown using PARG TLC activity assays. Silencing was conducted over 6 days, passaging cells every 48 h to achieve maximum PARG knockdown. Whole-cell extracts were prepared from cultured cells that had been treated with either control or PARG siRNA. PARG activities were detected by TLC analysis of reaction mixtures containing these cell extracts and 32P-labeled pADPr as a substrate. Substrate remained at the origin of the TLC plate, while ADP-ribose products migrated towards the top of the TLC plate following development by 0.3 M LiCl and 0.9 M ethanoic (acetic) acid. (D) Relative PARG residual activity in SK-N-SH cells after 6-day silencing as determined from the TLC quantification of PARG reaction products.

