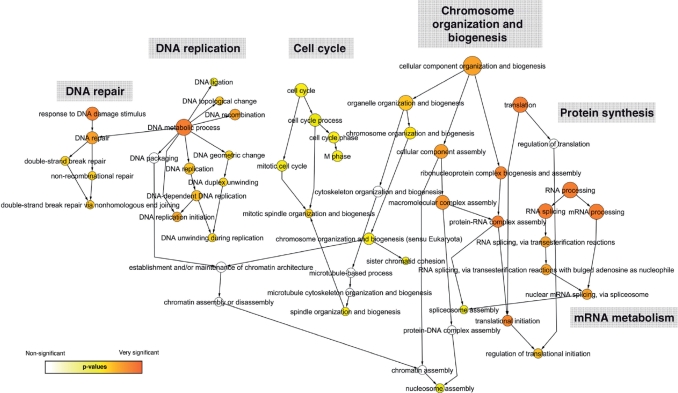
Figure 7.
Graphical network representation of pADPr-associated proteins identified by LC-MS/MS in anti-pADPr immunoprecipitates. Functional categorization of pADPr-associated proteins was performed using GO annotations. Over-represented categories were statistically identified using BiNGO and visualized with Cytoscape. The size of the terms (circles) is representative of the proportional protein abundance in the dataset and the color shading indicates the degree of statistical significance (darker shades indicate stronger significance).

