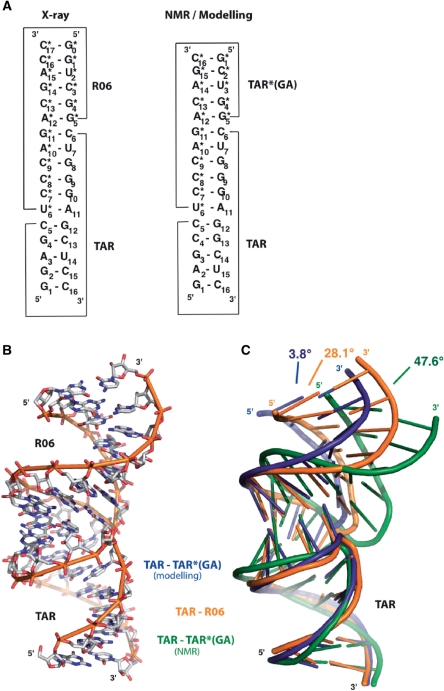
Figure 1.
Structure of TAR–R06 aptamer loop–loop complex. (A) Sequence and secondary structure of TAR–R06, TAR–TAR*(GA) from NMR and modelling. Asterisks refer to aptamer residues (28,29). (B) Overall crystal structure of TAR–R06 complex. (C) Superimposition of the TAR–R06 crystal structure (orange) with the TAR–TAR*(GA) liquid-crystal NMR structure (green) and the TAR–TAR*(GA) structure from Molecular Dynamics (blue) was performed with the least-square method using TAR as a reference structure (28,29). Inter-helix angles were measured in MOLecule analysis and MOLecule display (MOLMOL) by generating an axis in each stem over the first four base pairs (50).

