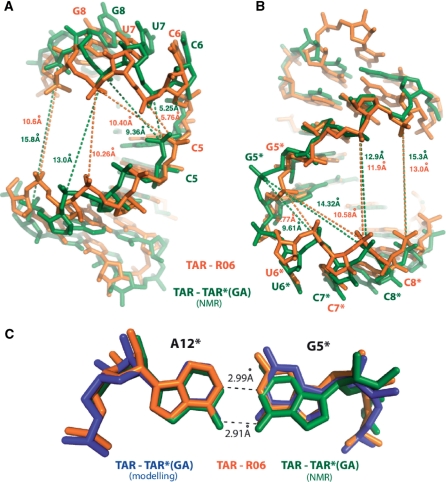
Figure 2.
Structure at the stem-loop junctions. (A) Pairwise superimposition of the TAR (X-ray, orange)–TAR (NMR, green) stem-loop junctions is displayed. Distances between C5 phosphate atom and U7 and G8 phosphate are displayed (TAR from the X-ray structure is shown orange, TAR from the NMR is shown in green). (B) Pairwise superimposition of the R06 (orange) and TAR*(GA) is displayed. Distances between G5* and C7* and C8* phosphate atoms are indicated. (C) G5*–A12* kissing loop closing pairs is shown and distances are given in black. TAR–R06, TAR–TAR*(GA) NMR and modelling are displayed as in Figure 1.

