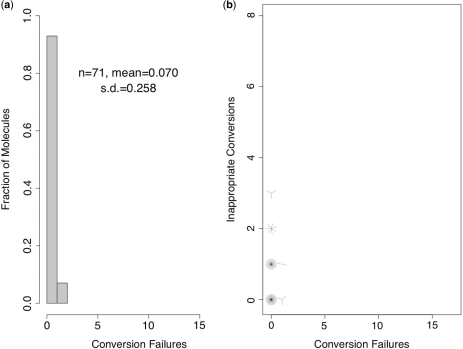
Figure 7.
Hairpin-linked DNA treated under the published hairpin-bisulfite PCR protocol. (a) Distribution of failed-conversion counts. We use n to indicate the number of molecules examined; conversion failures are summarized by the mean number of failed-conversion events per molecule and the SD on this mean. (b) Sunflower plot of individual-molecule failed- and inappropriate-conversion counts. A single point indicates one molecule, a line indicates two and a z-petaled ‘flower’ indicates z-molecules.

