Figure 3.
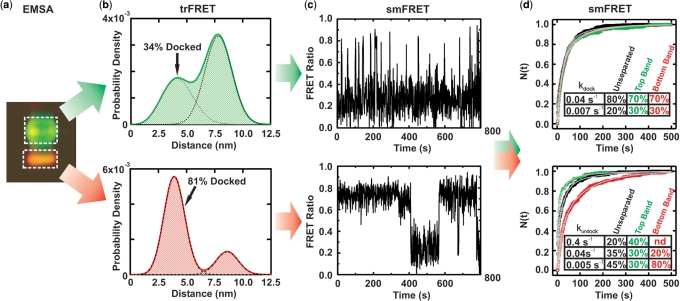
FRET characterization of EMSA separated ribozyme. (a) EMSA-based separation of fluorophore-labeled ribozyme showing differences in gel mobility and FRET (pseudo-color, green donor, red acceptor). RNA from the boxed areas was isolated as T and B species for further analysis. (b) Probability distribution of inter-fluorophore distance in the T and B species as derived by trFRET analysis, with fraction of docked material indicated. (c) Exemplary time trajectories characteristic of the sub-populations that are most enriched in the isolated T and B species. (d) The T and B species exhibit significantly different undocking kinetics in single molecule dwell-time analyses. The normalized fraction of dwell times (N) shorter than time (t) in the undocked (top) and docked states (bottom) are plotted for the isolated T (green) and B (red) species as well as the unseparated ribozyme (black). Solid gray lines indicate the multi-exponential global fits used to determine the (un)docking rate constants; the time-window corrected fraction of molecules (un)docking with the given rate constant is indicated in the table insets.

