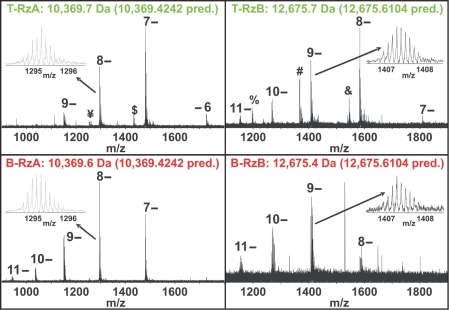
Figure 6.
FT-ICR mass spectrometry analysis of EMSA separated ribozyme. Negative mode ESI FT-ICR mass spectra show peaks generated from intact molecular ions of both RzA and RzB at different charge states as indicated, as well as additional peaks with relatively low abundance. The insets show zoomed in spectra of the 8-charge state for the RzA strand and the 9- charge state for the RzB strand. The experimental average masses are given above the spectra and the predicted masses are indicated in parentheses. Minor peaks ¥ and $ represent the 8- and 7-charge states, respectively, of a fragment resulting from loss of a single adenosine monophosphate from the 5′-end of T-RzA; minor peak & represents the 8-charge state of a fragment resulting from loss of a single uridine from the 3′-end of T-RzB; minor peaks % and # represent the 8- and 7-charge states, respectively, of the 5′-fragment resulting from backbone cleavage between C-2 and A-1.

