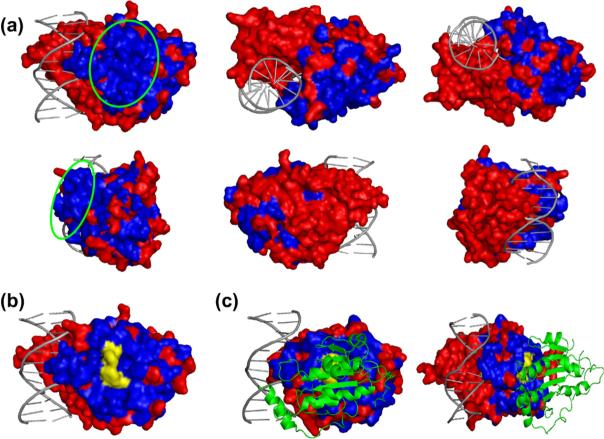
Fig. 4.
Display of conserved surface regions on a structural model29 of CD-Dnmt3a. (a) Different views of the structural model of CD-Dnmt3a in complex with DNA. Mutations that did not disrupt interaction with Dnmt3L and the C-terminal part of the protein (that is not important for interaction) are colored red. The single large surface region free of mutations that is highlighted by a green circle indicates the putative interacting region. (b) Surface of the structural model of CD-Dnmt3a colored as shown in (a). The yellow area indicates the position of residues whose exchange disrupted the interaction of CD-Dnmt3a with Dnmt3L. (c) Structure of the CD-Dnmt3a in complex with CD-Dnmt3L.30 Coloring of CD-Dnmt3a is the same as in (b). CD-Dnmt3L is shown as a green ribbon model.

