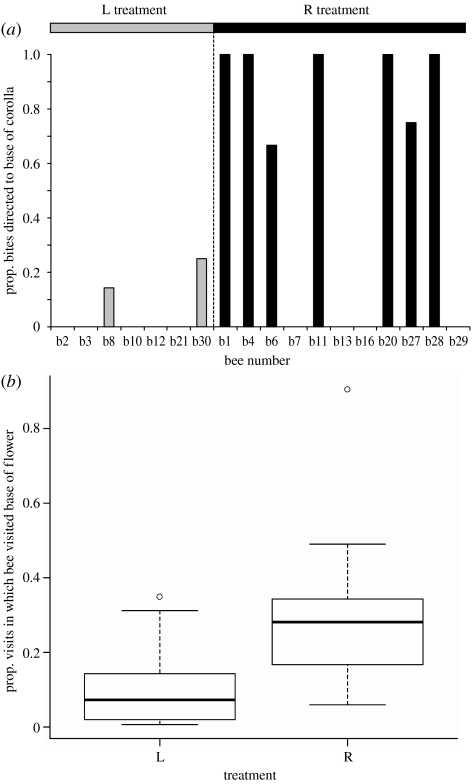
Figure 2.
(a) Biting preferences. The proportion of bites directed to the base of the flower for each individual bee that exhibited any biting behaviour is represented in groups R (black bars) and L (grey bars). (b) Visitation preferences. Box plots represent the proportion of flower visits in which the base of the flower was visited, for only those bees that never created robbing holes for themselves. Boxes represent median and interquartile range and narrow lines within the boxes depict the full range of the data, but exclude outliers indicated as open circles. Data are presented prior to log transformation.

