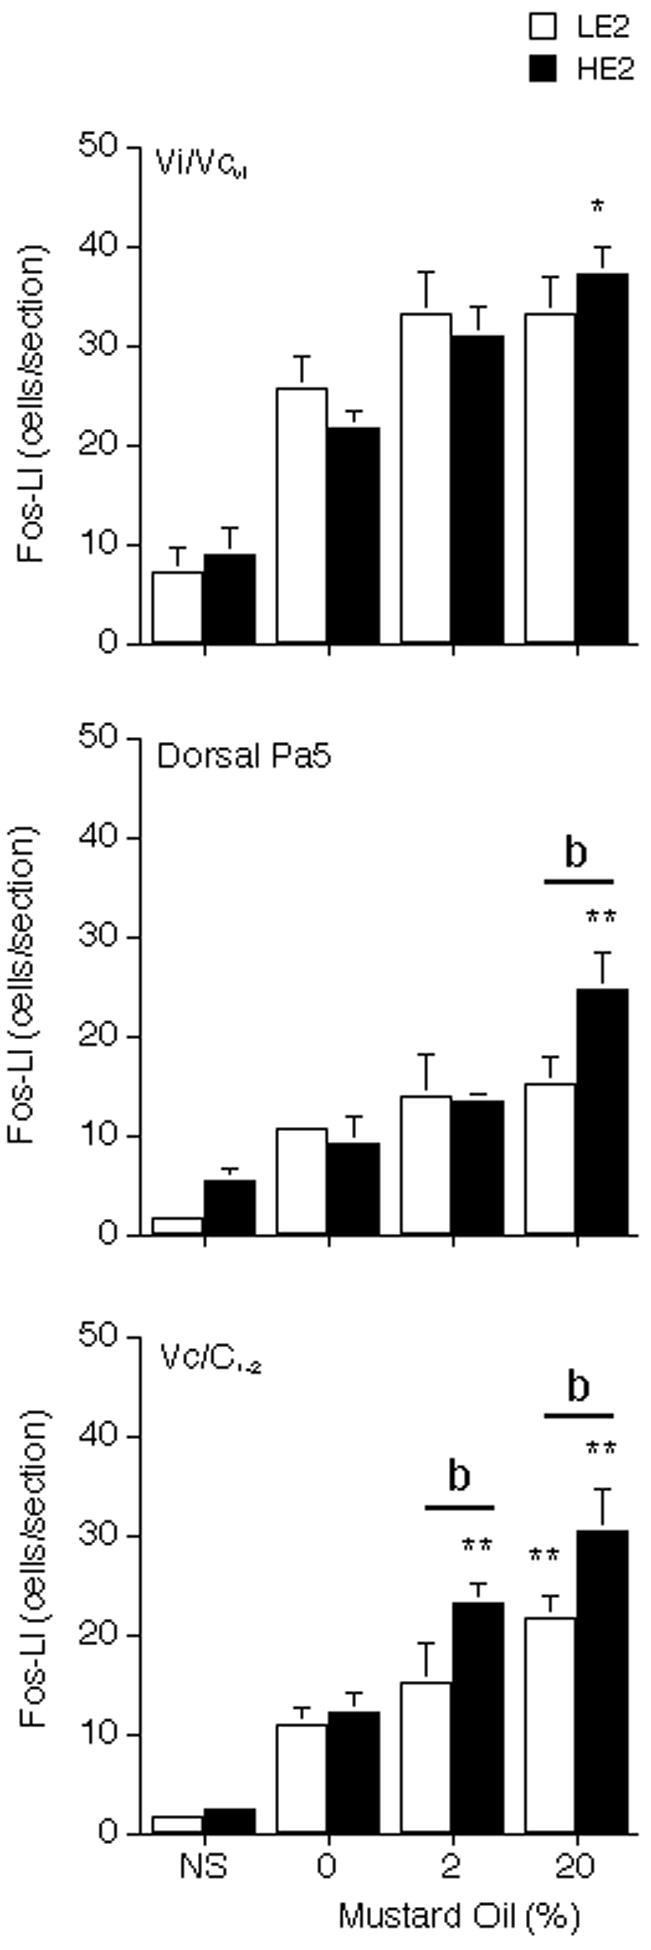
Figure 3.

Effect of different concentrations of MO on the average number of Fos-positive neurons produced in the ipsilateral TBNC in HE2 and LE2 rats after TMJ stimulation. Upper panel, Vi/Vcvl transition region; middle panel, dorsal Pa5 region; lower panel, Vc/C1-2, junction region. Abbreviations and symbols: NS = no stimulus controls; *P < 0.05, **P < 0.01, versus 0% MO group; b = P < 0.01 HE2 versus LE2.
