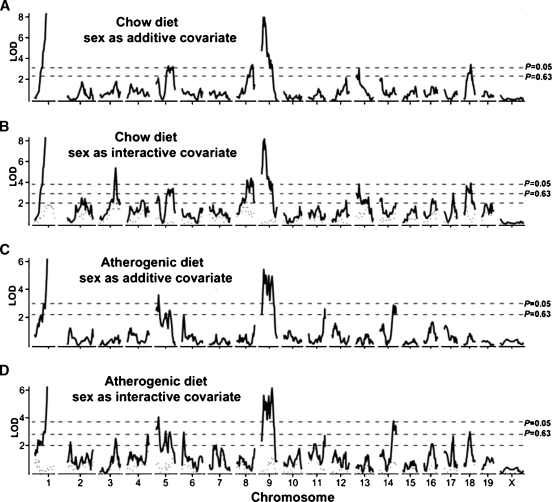
Fig. 2.
Genome-wide scans for high-density lipoprotein cholesterol (HDL). A: Chow-fed mice with sex as additive covariate. B: Chow-fed mice with sex as interactive covariate. C: Atherogenic diet-fed mice with sex as additive covariate. D: Atherogenic diet-fed mice with sex as interactive covariate. The horizontal dashed lines represents the suggestive (P = 0.63) and significant (P = 0.05) genome-wide levels as determined by 1,000 permutation tests. The dotted curves at the bottom of B and D depict the Δ logarithm of the odds ratio (LOD) scores between scans A and B, and C and D, respectively. ΔLOD > 2.0 (denoted by the lower horizontal dashed line in B and D) indicates a quantitative trait loci (QTL) that differ significantly between sexes (P < 0.05).

