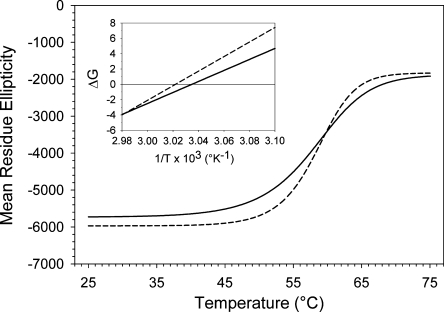
Fig. 3.
Thermal denaturation of apoB19 and apoB20.1. Mean residue ellipticity at 222 nm of 1 μM solutions of apoB19 (dashed line) and apoB 20.1 (solid line) was sampled at two second intervals as the temperature was raised from 25 to 75°C. The lines are sigmoidal curve fits of the data. Inset: Van't Hoff plots; the solid lines are linear curve fits of the thermal denaturation data. Intercepts of the lines at the X axis yield the reciprocal of the transition temperature midpoint.

