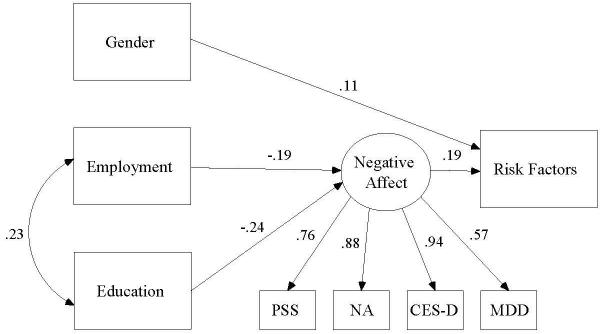
Figure 3.
Model of the relationships among gender, socioeconomic status indicators, negative affect, and the total number of modifiable cancer risk factors. Note: PSS = perceived Stress Scale, NA = Negative Affect as measured by the positive and Negative Affect Schedule, CES-D = Center for Epidemiological Studies - Depression, MDD = Probable Major Depressive Disorder as measured by the patient Health Questionnaire.

