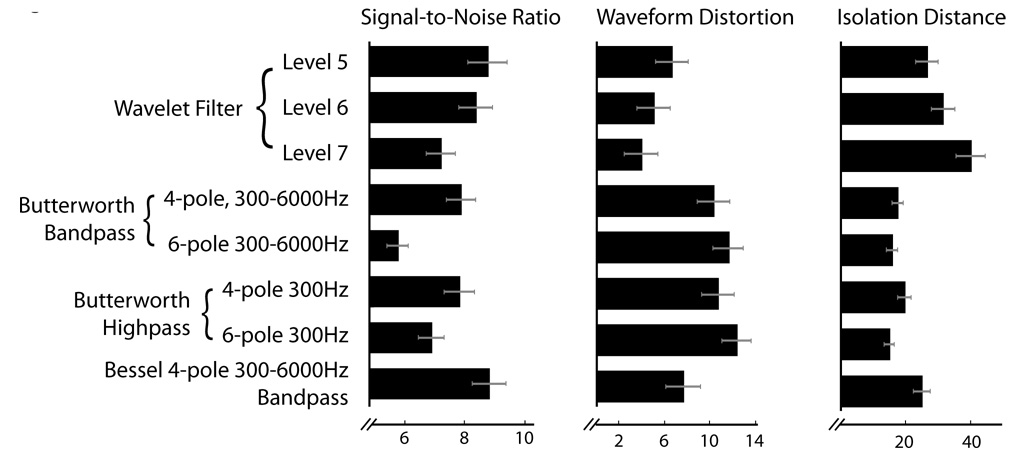
Figure 6.
Quantitative comparison of different filtering methods. Left: The SNR (see Methods) determines spike detectability. Middle: Waveform distortion is calculated as the mean squared Euclidean distance between each cell’s mean unfiltered waveform and mean filtered waveform (n=47 projection cells). The waveforms are normalized such that the unfiltered waveform has peak height 1. The Isolation Distance (see Methods) is calculated using 3 PCA coefficients per wire (on 4 wires) performed on a 400µs window of the spike, centered on the peak.

