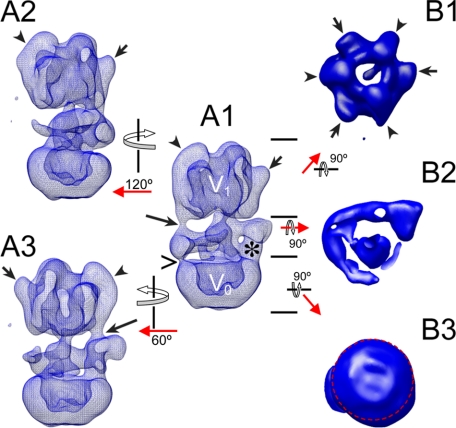
FIGURE 1.
Three-dimensional structural model of the yeast vacuolar ATPase. The model was calculated from a data set of 25,000 single images at ∼25 Å resolution. The short arrows and arrowheads point to the elongated- and knob-like densities at the top of the V1. The long arrows point to the peripheral stalks resolved in the three-dimensional model. The > sign points to a thin connection between subunit C and the membrane domain (see below for a discussion on the binding position of subunit C). The asterisk indicates the location of the N-terminal domain of subunit a (ant). The short arrows and arrowheads in B1 point to the alternating A and B subunits in the V1, respectively. The image in B2 shows the arc-like arrangement of the peripheral stalk proteins surrounding the central stalk. The image in B3 shows the bottom view of the V0. The asymmetry of the V0 is indicated by the red circle. For details, see text.

