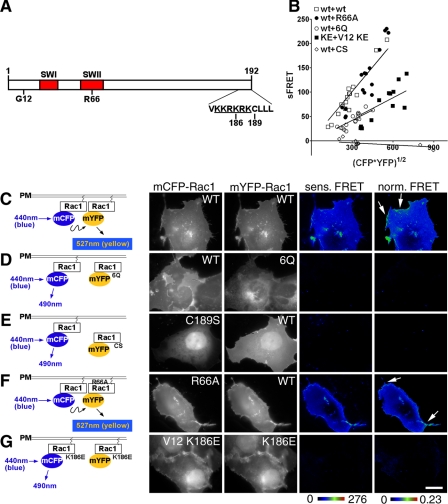
FIGURE 1.
Rac1 self-association requires determinants important for plasma membrane localization. A, schematic of Rac1 derivatives used in this work. SW1 and SW2, Switch I and Switch II regions. Gly12 (G12), Arg66 (R66), and Lys186 (K186) are the sites of constitutively active, RhoGDI binding-defective, and PIP5Kα binding-defective mutations, respectively. KKRKRK, polybasic region (underlined). Cys189 (C189) is the site of Rac1 geranylgeranylation. B, reduced self-association in the absence of membrane localization or loss of the PBR. The mCFP- or mYFP-Rac1 derivatives noted in B were cotransfected into COS1 cells, and FRET measurements were determined (see “Materials and Methods”). Sensitized FRET from 20 regions of interest (see “Materials and Methods”) were plotted as a function of the intensity of the mCFP-Rac1 donor and mYFP-Rac1 acceptor. C-G, left, schematic diagrams for detecting Rac1-Rac1 self-association using FRET. Monomeric forms of CFP and YFP were fused to the NH2 terminus of Rac1, as displayed in schematic diagrams. Derivatives in which mYFP-Rac1 is defective for plasma membrane localization (e.g. Rac1 6Q and Rac1 C189S) are defective for interaction with wild-type Rac1 on the plasma membrane and thus failed to produce FRET. Right, COS1 cells were transfected with mCFP-Rac1 and mYFP-Rac1 having the indicated mutations. The cells were fixed and analyzed by FRET using fluorescence microscopy (see “Materials and Methods”). Sensitized FRET (sens. FRET) corresponds to the total amount of FRET, whereas normalized FRET (norm. FRET) corresponds to the amount of FRET per unit of fluorescent protein (see “Materials and Methods”). Both sensitized FRET and normalized FRET are displayed as color gradient look-up tables, with the appropriate scale bars below each panel. The arrows indicate membrane ruffles that were concentrated at sites of Rac1 recruitment. White scale bar in G, 10 μm (applies to all panels).

