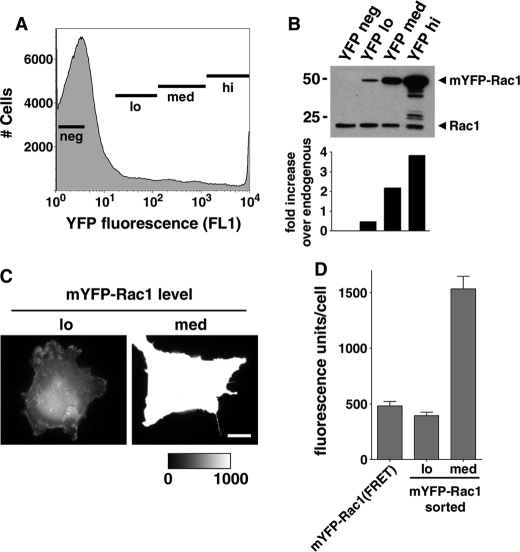
FIGURE 2.
FRET analysis of Rac1 self-association was performed at physiological Rac1 levels. A, mYFP-Rac1-transfected COS1 cells were sorted according to fluorescence (negative (neg), low fluorescence (lo), medium (med), and high (hi)). B, sorted cells were lysed and analyzed by Western blotting, probing with a monoclonal Rac1 antibody (top). Blots were scanned, and the extent of overexpression with respect to endogenous Rac1 levels was quantified by densitometry (bottom). C, sorted cells were plated onto fibronectin-coated coverslips and allowed to adhere. YFP fluorescence images were collected from low and medium fluorescence populations. Two representative images are displayed where the med image has been normalized to the fluorescence maximum of the lo image, as indicated by the look-up table. White scale bar, 10 μm. D, fluorescence intensity of the low and medium fluorescence populations was quantified exactly as the FRET analysis. Data are displayed as average YFP fluorescence ± S.E. on a per cell basis. Average YFP fluorescence from a typical FRET experiment is included in this graph for comparison purposes.

