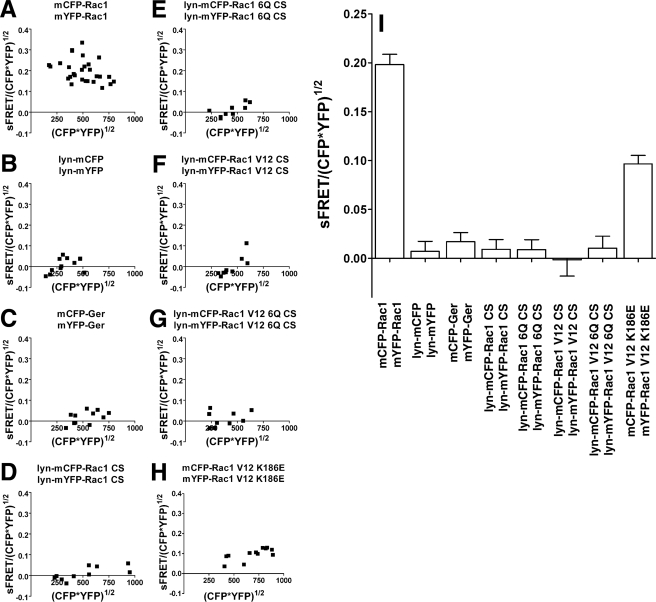
FIGURE 5.
Rac1 self-association of Rac1(WT) is independent of expression levels. A-H, COS1 cells were cotransfected with mCFP-Rac1 and mYFP-Rac1 constructs, and Rac1 self-association was determined by FRET in two regions of interest (ROI) within each cell. Each data point represents results from a single cell, and data are plotted for 20 cells per construct (see “Materials and Methods”). Sensitized FRET determinations were then normalized to the total concentration of both derivatives, calculated as (mCFP-Rac1 × mYFP-Rac1)1/2, and data were plotted as a function of the concentration of the derivatives in each of the regions of interest. Each panel shows data for the noted derivatives. I, summary of data from A-H. Data are plotted as the mean of the normalized FRET determinations ± S.E.; pooling data from all of the analyzed transfectants are displayed in A-H.

