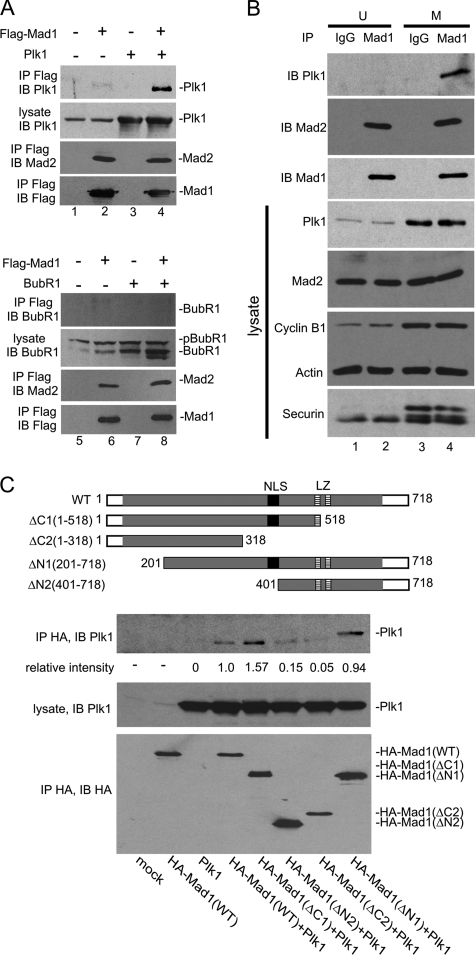
FIGURE 2.
Mad1 interacts with Plk1. A, cells transfected with FLAG-Mad1 and/or Plk1 (untagged), or BubR1 (untagged) were enriched in M phase by nocodazole treatment. Immunoprecipitations (IP) were performed using anti-FLAG, and the immunoprecipitates were analyzed by Western blotting using anti-FLAG, anti-Mad2, anti-Plk1, or anti-BubR1 as indicated. Plk1 and Mad2 (top panels), but not BubR1 (bottom panels), were co-immunoprecipitated with Mad1. B, cell endogenous Mad1-Plk1 interaction was examined by co-immunoprecipitation using αMad1-N and αMad1-C antibodies. Nonspecific rabbit IgG was used as control. Cells were either asynchronous (U) or M-synchronized by nocodazole. Immunoblottings (IB) of transfected cell lysates were performed for Plk1, Mad2, cyclin B1, actin, and securin (bottom 4 panels). Immunopreciptates of the same cell lysates were recovered using αMad1-N and αMad1-C antibodies, and these were immunoblotted for Plk1, Mad2, and Mad1 (top 3 panels) to show that Mad1-Plk1 interaction occurred preferentially in M. C, co-immunoprecipitation of Plk1 with Mad1 WT or the indicated Mad1 deletion mutants. Cells were mock transfected or transfected with the indicated expression plasmids (see labeling at bottom). HA-tagged WT and Mad1 deletion mutants (ΔN1:201-718, ΔN2:401-718, ΔC1:1-518, and ΔC2: 1-318; schematic illustration at top) were used. The immunoprecipitation/immunoblotting of the HA-tagged Mad1 proteins is shown in the bottom panel. The middle panel shows equal amounts of transfected Plk1 in each of the cell lysates. The top panel shows the amount of Plk1 recovered with the respective Mad1 immunoprecipitation. The relative intensities of the Plk1 band normalized to the immunoprecipitated HA-Mad1 signals are shown numerically below the top gel panel. Band intensities were quantified using ImageJ software.

