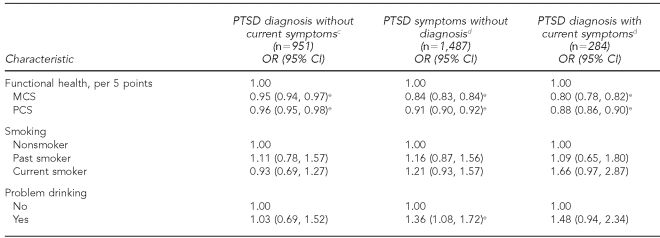
Table 5. Weighteda and adjustedb odds of reporting PTSD symptoms when compared with reporting of no PTSD symptoms (n=72,225) using multivariate polychotomous logistic regression for potential comorbidities (2001–2003).
aWeighted for response differences in gender, birth year, education, marital status, race/ethnicity, military rank, and military component. Only participants with complete data were included in this table. Adjusted for past chem/bio exposures, sex, birth year, education, marital status, race/ethnicity, deployment experience, other combat-like exposures, military rank, service component, branch of service, and occupational category.
bAdjusted for sex, age, education, marital status, race/ethnicity, chem/bio exposure, previous deployment, other combat-like exposures, rank, component, service branch, and occupation
cIncludes participants previously told they had PTSD by a health-care professional without current symptoms based on the PTSD Patient Checklist (PCL-C).
dPTSD symptoms at baseline enrollment determined using the PTSD PCL-C.
eStatistically significant at α<0.05
PTSD = posttraumatic stress disorder
OR = odds ratio
CI = confidence interval
MCS = mental component summary
PCS = physical component summary

