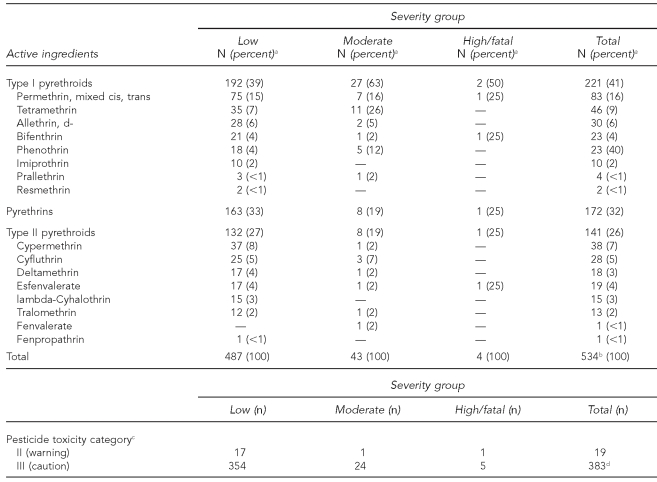
Table 3.
Frequency of active ingredients and pesticide toxicity category for 407 cases of pyrethrin or pyrethroid pesticide exposure by case severity grouping, Oregon and Washington, 2001–2005
aIndicates column percentage
bThere could be multiple active ingredients per case.
cBased on U.S. Environmental Protection Agency categorization
dThere could be more than one product per case, no products per case (if only active ingredients were reported), or products besides pyrethrins or pyrethroids per case if more than one product was used.

