
Figure 4. Assessment of RNA decay in strain DW120.
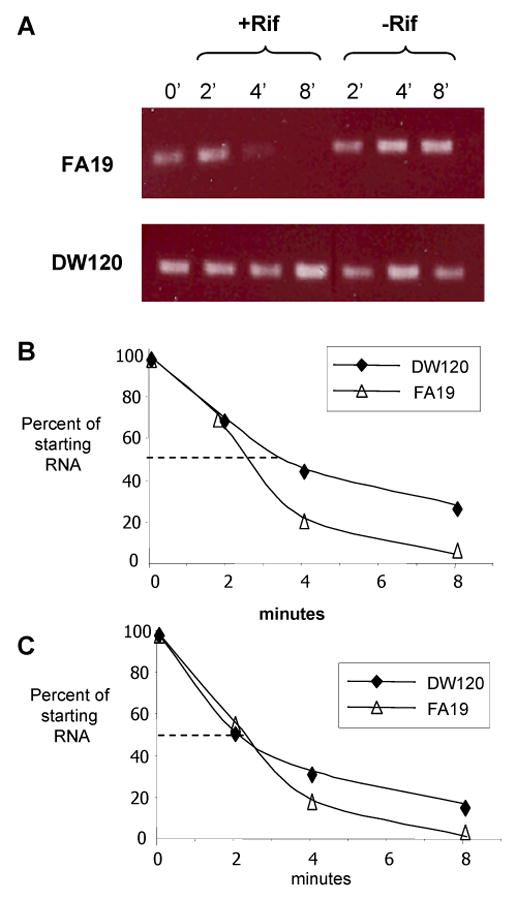
(A) Equal quantities of RNA from strain FA19 (top) and DW120 (bottom) were reverse transcribed and used in a PCR reaction to determine if there was a difference in the degradation rate of mtrC message. Samples were taken pre (T0) and post rifampicin treatment (+Rif); a second set of cultures to which no rifampicin was added (-Rif) were grown in parallel. (B) RNA samples were also reverse-transcribed and used in a qRT-PCR protocol to quantify amounts of mtrC and rmp RNA from strains FA19 and DW120. These values were used to calculate the RNA half life for mtrC and rmp. The experiment was performed twice and the results were similar.