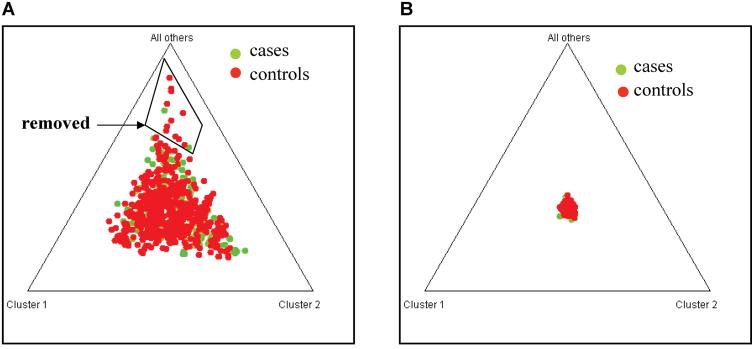
Figure 1.
Identification of population stratification using the STRUCTURE program. (A) Genotyping data for 38 AIMS from cases (green) and controls were analyzed to identify outlier individuals (boxed). The 14 outliers include 2 cases and 12 controls. (B) After removal of 14 outliers, the new cases and controls match each other very well as noted by compact overlapping of cases and controls in the center of the graph.

