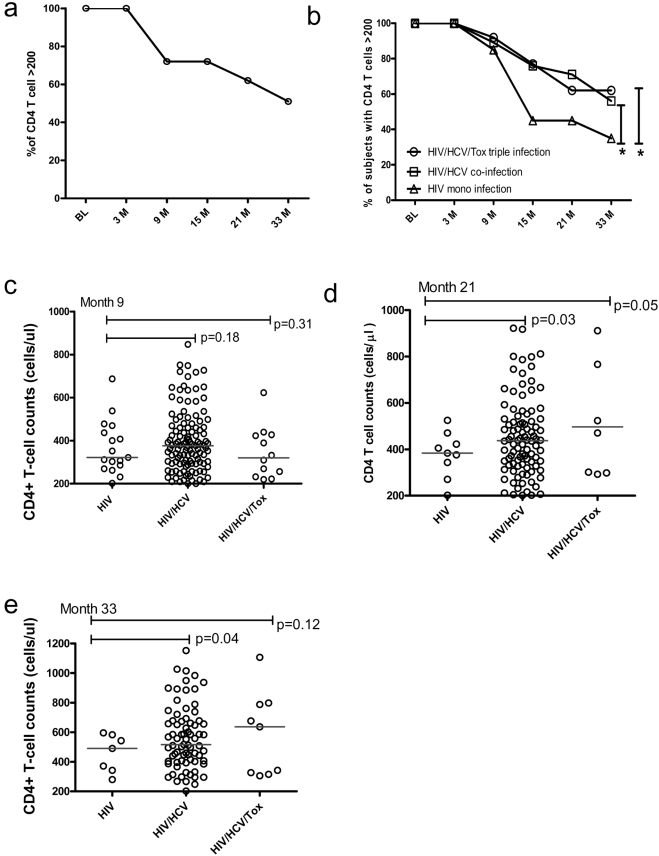
Figure 2. Disease progression during our follow-up.
a, the percentage of subjects remained with CD4+ T cell counts >200 cells/µl during the follow-up visits The X axis indicates the different time-points of sampling at baseline (BL), month 3 (3M), month 9 (9M), month 15 (15M), month 21 (21M), month 33 (33M) after enrollment; Y axis is the percentage of subjects whose CD4+ T-cell counts remained as >200; b, the percentage of subjects remained with CD4+ T-cell counts >200 cells/µl during the follow-up visits among different groups as indicates in the figure, X and Y axis are labeled identically to figure 2a;. * indicated p<0.05; c, d, e, CD4+ T-cell counts among different groups at month 9 (c), month 21 (d) and month 33 (e).

