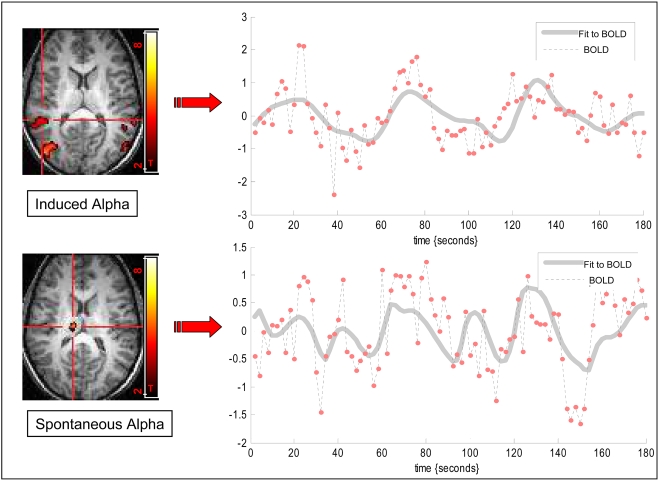
Figure 5. BOLD time course related to spontaneous and induced alpha networks.
BOLD time course of a single subject was extracted from induced alpha region of interest (ROI) in left STS (top, P<0.0001) and from the spontaneous alpha network in the thalamus (bottom, P<0.0001). The dashed line denotes the measured BOLD time course and the grey line denotes best fit to BOLD oscillations. It is evident that the BOLD time course extracted from the induced alpha network corresponds to the paradigm based alpha modulation while the time course based on spontaneous oscillations corresponds to the on-going alpha modulation.

