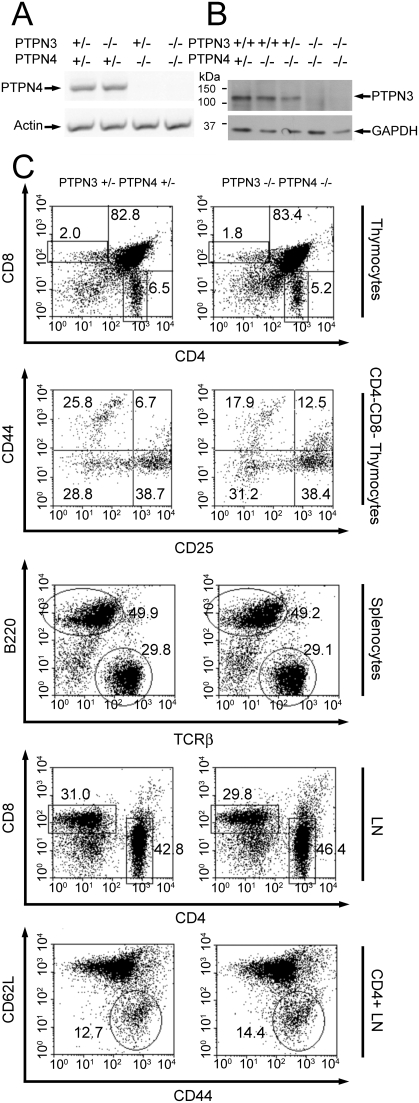
Figure 3. PTPN4/PTPN3 double-deficient mice show normal T cell development.
A) Expression of PTPN4 in mice of the indicated genotypes (top) determined by RTPCR. B) Expression of PTPN3 in mice of the indicated genotypes (top) determined by Western blotting. Blots were stripped and reprobed with GAPDH antibodies to confirm equivalent protein loading. C) Flow cytometry plots of thymocytes and peripheral immune cells from PTPN4−/−PTPN3−/−mice and littermate controls showing expression of the indicated markers on live cell populations. In CD44/CD62L plots, the gated population represents recently activated memory T cells. Data are representative of six repeat experiments.

