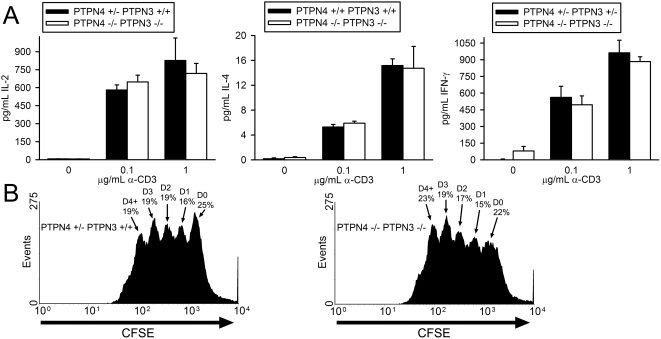
Figure 4. T cell cytokine synthesis and proliferation in PTPN4/PTPN3 double-deficient mice.
A) LN T cells were stimulated with the indicated concentrations of CD3 antibody and 0.75 µg/mL CD28 antibody. Concentrations of cytokines in supernatants were determined as in Figure 2. Each bar represents the mean plus one standard deviation of triplicate determinations from one mouse. Differences between mice are not statistically significant (Student's T-test). Data are representative of six repeat experiments. B) Splenic T cells were labeled with CFSE and stimulated with 0.1 µg/mL CD3 antibody and 0.75 µg/mL CD28 antibody. After 72 h, CFSE dye intensity was measured by flow cytometry. The percentage of live cells that have undergone the indicated number of cell divisions is shown. Data are representative of three repeat experiments.

