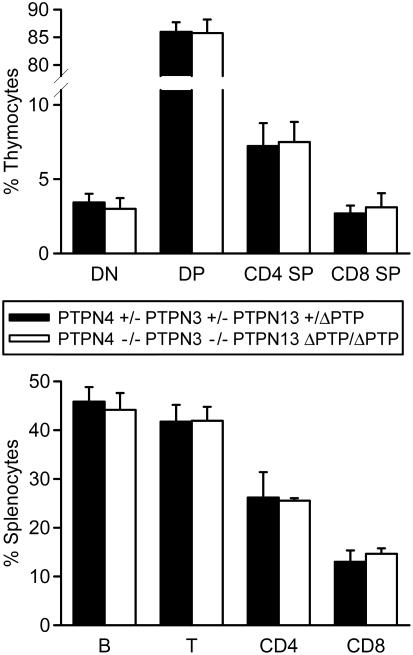
Figure 5. Normal T cell development in PTPN4/PTPN3 double-deficient PTPN13 ΔPTP/ΔPTP mice.
Thymocytes and splenocytes from mice of the indicated genotypes were analyzed by flow cytometry for expression of T cell and B cell markers. Shown is the mean percentage representation plus one standard deviation of the indicated subpopulations among total live cells (n = 4 mice of each genotype). Differences between mice are not statistically significant.

