
Figure 3.
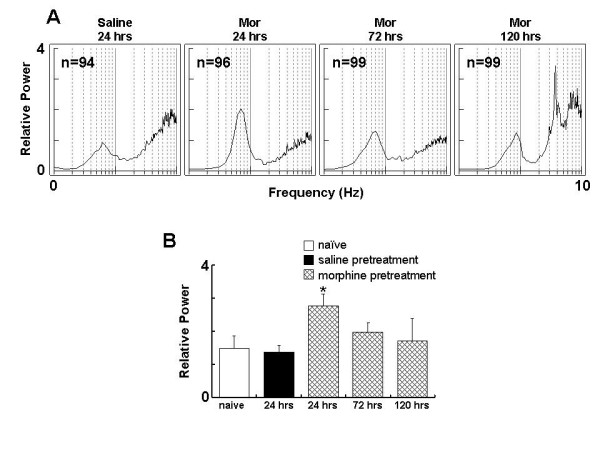
Single morphine exposure alters firing pattern of VTA DA neurons. Rats received morphine (20 mg/kg, s.c.) or saline. A: spectral charts at 24, 72, 120 hours after the treatment. B: group summary. *P < 0.05, compared to saline control. Mor: morphine.