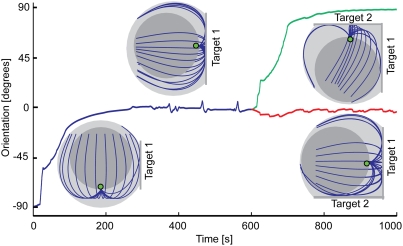
Figure 2. Centrosome reorientation in the model.
Dynamics of the centrosome orientation in a T cell developing sequentially two synapses is shown. The insets are computer-generated snapshots of the actual numerical model cell. The graphic conventions are the same as in Figure 1. Flattened interfaces with target cells are also depicted. The centrosome is initially pointing down (orientation −90°), and the first synapse develops on the cell equator (orientation 0°). The evolution of the centrosome orientation with time is shown by the blue plot. Note the oscillations following the stabilization of the equatorial position of the centrosome. After this (at t = 10 min) the model cell is set to develop the second synapse. In one version of the simulation (green plot), the second synapse develops on the top of the cell, and the centrosome rapidly migrates to it. In the alternative branch of the simulation (red plot), the second synapse develops on the bottom of the cell. In this case, the centrosome does not leave its position near the middle of the first synapse (red line). Both of the alternative centrosome positions seen at the end of this graph persist for much longer than plotted. Pulling force density, 40 pN/µm; microtubule length, 16 µm; effective cytoplasm viscosity, 2 pN s/µm2.

